Reports in WooCommerce give you the ability to see your store’s performance from month to month using graphs and stats. It has three sections: Orders, Customers and Stock.
Orders
Orders reports allow you to view gross and net sales volume and totals, as well as top sellers, top freebies and top earners. Sub-sections are shown below.

Sales by date
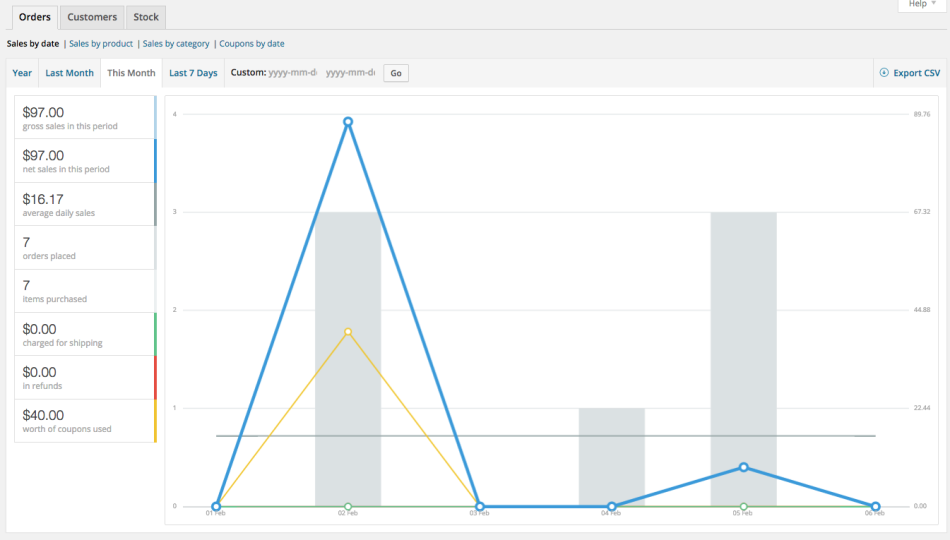
The orders tab starts with the sales by date section – this gives you an idea of the current performance via a sales graph and a few way ways to drill down into data as well. By year, last month, this month, last 7 days, and a custom date range.
The sales graph itself shows the amount of gross sales plotted on a light blue line, the net sales plotted in dark blue , the shipping amount plotted in green, refunds plotted in red, and coupon values redeemed in orange. Hovering over a point will give you the exact figure.
Sales by product
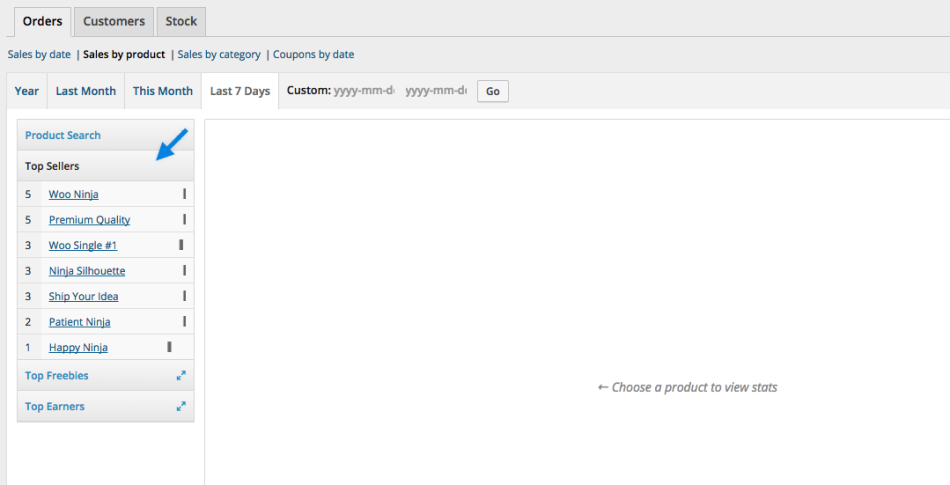
The sales per product section shows sales per day in a given range, similarly to the overview section:

You can select any product from your store to view sales data, and again drill down into by year, last month, this month, last 7 days, and custom.
Sales by category
Just as sales by product works, you can see the sales numbers by categories as well.

Customers
The next tab you have is to view customer reports with Customers vs. Guests and Customer List options to further drill down into customer info again by year, last month, this month, last 7 days, and custom.
- In Customers vs. Guests, customers are paying users who register on your website
- By consequence, Customer List will only show registered users

Stock
Similar to the dashboard widget, stock reports list your low stock and out of stock items as well as the actual quantity left in stock.